

Before you read any further, I want to warn you that this blog post contains a significant amount of algebraic equations applied to Teen Bible Quizzing explained in excruciating detail. Well, it may be excruciating to you but not to me. I’m actually pretty excited with the result. So, if you are brave – or just curious – please read on.
Though we all use a Quizzer’s average points per game to determine individual placement at the conclusion of a quiz meet, it does not tell the whole story. Say, for example, that Diane and Bruce both finish a 10-game tournament tied for 10th place with a 40 average. Bruce averaged 1 Error per game while Diane had 2 Errors per game. So, Bruce gets the medal for 10th place. However, what we do not consider is that Bruce missed all 10 of his Bonus opportunities while Diane answered all 10 of hers. Also, Bruce’s 1 Error each game happened after Question 15, costing his team 10 points each time. Also, every error turned into 10 points for the opposing team when they correctly answered the Bonus. Diane was more careful and did not error after question 15 in any game. Only one of Diane’s two errors each game resulted in Bonus points for the opposing team. Looking at the net points contributed to their respective teams, Bruce averaged 20 points per game while Diane averaged 40.
Though the details of this scenario are fictional, something similar does happen at every quiz meet. So it seems odd to me that the only statistics that we really track are team wins, individual averages, and individual errors. While I understand why we do not include points from Bonuses as part of an individual’s average, there are so many more events that happen during each match that contribute to the final score: cumulative team errors, error-outs, perfect game bonuses, and errors after question 15 to name just a few. It would be as if the NFL only tracked each team’s wins, total yards per game for each offensive player, and turnovers.
A HISTORICAL ANALOGY
In fact, our current statistical quandary mirrors where the NFL was in the mid-1930s. At that time the NFL had already been struggling for many years with how to recognize the top quarterback. Back then it was the passer with the most passing yards. From 1938-1940 it was the quarterback with the highest completion percentage. In 1941, the NFL started ranking quarterbacks relative to their peers’ performance each season. As you could imagine, doing so made it impossible to compare quarterbacks until all the games were completed each week, or to compare quarterback performances to prior seasons. It wasn’t until 1973 that the NFL developed the NFL Passer Rating formula that is still used today. Using quarterback data between 1960 and 1970, it established passing standards based on a passer’s completion percentage, yards per attempt, touchdowns per attempt, and interceptions per attempt. With each metric weighted equally, a statistically average quarterback would have a 66.7 rating, and a 100+ rating indicated an excellent performance (158.3 is the best possible rating).
Then something unexpected happened. Though the league’s passer rating average each year in the decade prior stayed consistent at around 66.7 (the slope of the trend line is almost flat), since 1973 the average passer rating has improved steadily to the point that the league average in 2019 was 90.4.
WHY WE NEED MORE DATA
The point I am trying to make as it applies to Teen Bible Quizzing is that quiz leaders could provide better guidance to their students if equipped with the right information. In the hypothetical situation above, Bruce could help his team more if he were to – for example – get advice on how to read the scripture and review practice questions more effectively to improve his chances of correctly answering Bonus questions. Diana obviously knows the material given that she mastered all the Bonus questions that came her way. I would encourage her to take more risks by jumping faster during competition. While they have the same average, each of them would benefit from different types of encouragement. Without key pieces of information those moments of high influence are likely not to happen.
Inspired by the aforementioned NFL Passer Rating, I set out to create a metric that could summarize a quizzer’s overall performance scaled to the competitiveness of a single tournament or their local District competition. The coaching advice I give to my top quizzers for District quizzes doesn’t work at a regional tournament – and vice-versa. I needed something that would reveal hidden details rather than rely on my hunches. Thus, the Advanced Quizzer Rating (AQR) was born! (Yeah, it could use a better name; working on that.)
HERE IS THAT MATH I WARNED YOU ABOUT
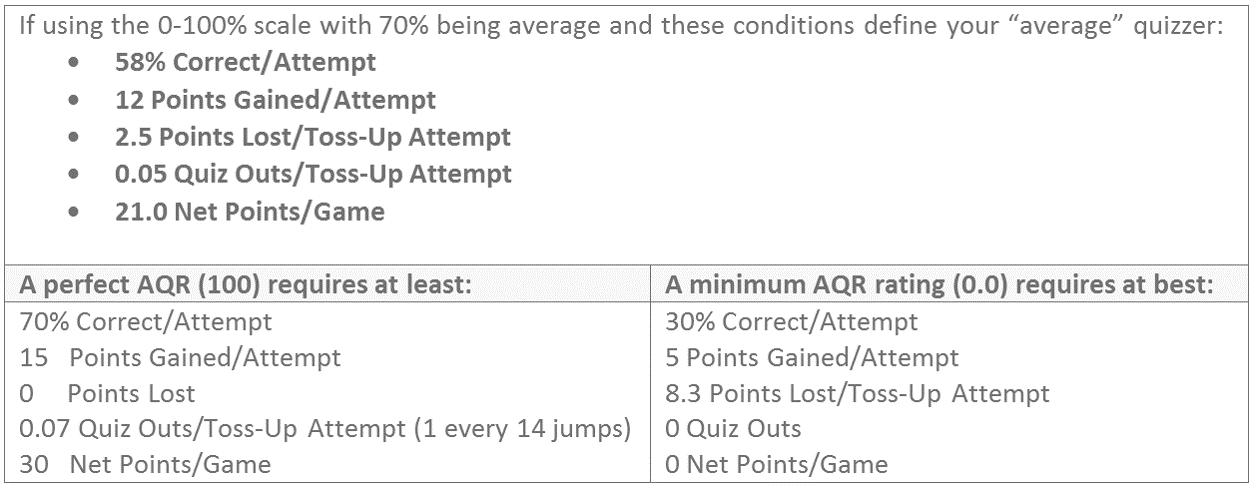
The Advanced Quizzer Rating measures five variables: correct answers per attempt, points gained per attempt, points lost per toss-up attempt, quiz-outs per toss-up attempt, and net points per game. The formulas using each of those variables are scaled to have a value between 0% and 100%, with 70% being statistically average for the tournament or your local District. I chose this scale to make it similar to the grading system in most schools. However, you could always adjust the variables to make 50% the average, if you so choose.
The five separate calculations are as follows:
where:
Variables β1 through β5 represent weighting coefficients specific to your situation:
The five calculations are then averaged to obtain the Advanced Quizzer Rating:
In fact, our current statistical quandary mirrors where the NFL was in the mid-1930s. At that time the NFL had already been struggling for many years with how to recognize the top quarterback. Back then it was the passer with the most passing yards. From 1938-1940 it was the quarterback with the highest completion percentage. In 1941, the NFL started ranking quarterbacks relative to their peers’ performance each season. As you could imagine, doing so made it impossible to compare quarterbacks until all the games were completed each week, or to compare quarterback performances to prior seasons. It wasn’t until 1973 that the NFL developed the NFL Passer Rating formula that is still used today. Using quarterback data between 1960 and 1970, it established passing standards based on a passer’s completion percentage, yards per attempt, touchdowns per attempt, and interceptions per attempt. With each metric weighted equally, a statistically average quarterback would have a 66.7 rating, and a 100+ rating indicated an excellent performance (158.3 is the best possible rating).
Then something unexpected happened. Though the league’s passer rating average each year in the decade prior stayed consistent at around 66.7 (the slope of the trend line is almost flat), since 1973 the average passer rating has improved steadily to the point that the league average in 2019 was 90.4.
WHY WE NEED MORE DATA
The point I am trying to make as it applies to Teen Bible Quizzing is that quiz leaders could provide better guidance to their students if equipped with the right information. In the hypothetical situation above, Bruce could help his team more if he were to – for example – get advice on how to read the scripture and review practice questions more effectively to improve his chances of correctly answering Bonus questions. Diana obviously knows the material given that she mastered all the Bonus questions that came her way. I would encourage her to take more risks by jumping faster during competition. While they have the same average, each of them would benefit from different types of encouragement. Without key pieces of information those moments of high influence are likely not to happen.
Inspired by the aforementioned NFL Passer Rating, I set out to create a metric that could summarize a quizzer’s overall performance scaled to the competitiveness of a single tournament or their local District competition. The coaching advice I give to my top quizzers for District quizzes doesn’t work at a regional tournament – and vice-versa. I needed something that would reveal hidden details rather than rely on my hunches. Thus, the Advanced Quizzer Rating (AQR) was born! (Yeah, it could use a better name; working on that.)
HERE IS THAT MATH I WARNED YOU ABOUT
The Advanced Quizzer Rating measures five variables: correct answers per attempt, points gained per attempt, points lost per toss-up attempt, quiz-outs per toss-up attempt, and net points per game. The formulas using each of those variables are scaled to have a value between 0% and 100%, with 70% being statistically average for the tournament or your local District. I chose this scale to make it similar to the grading system in most schools. However, you could always adjust the variables to make 50% the average, if you so choose.
The five separate calculations are as follows:
- a = (# Correct / # Attempts – β1) x 2.5
- b = (Points gained / # Attempts – β2) x 0.1
- c = 1 – (Points Lost / # Toss-Up Attempts x 1/ β3)
- d = (# Quiz Outs / # Toss-Up Attempts) x β4
- e = (Net Points / # Games) x 1/ β5
where:
- “# Correct” is the total number of Toss-Up and Bonus questions answered correctly.
- “# Attempts” is the total number of Toss-Up and Bonus questions attempted.
- “Points Gained” is the total amount of points earned. Points are earned from Toss-Ups, Bonus questions, Perfect Game bonuses, and the player’s share when contributing to the team’s 3rd, 4th, and 5th Person bonus.
- “Points Lost” is the total amount of points (or point margin) lost for their team. Points are lost from the error-out penalty, errors on questions 16-20, any error beginning with the team’s 5th error before question 16, and points gained by the opposing team resulting from the player’s error. As in game situations, error points do not accumulate for certain situations (error-out on question 17, or example). However, it is possible to get 20 points credited as “Points Lost” on a question if points are lost for the error and the opposing team correctly answers the Bonus.
- “# Toss-Up Attempts” is the total number of Toss-Up attempts (jumps) only.
- “# Quiz Outs” is the total number of times the player quizzes-out of a game.
- “Net Points” is ‘Points Gained’ minus ‘Points Lost’.
- “# Games” is the number of games in which the player was in the line-up.
Variables β1 through β5 represent weighting coefficients specific to your situation:
- β1 is the minimum acceptable Correct/Attempt for the tournament or league. It is 28% less than your league average when this equation using the statistical average is set to 70%.
- β1 is the minimum acceptable Points Gained/Attempt for the tournament or league. It is 7 less than your league average when this equation using the statistical average is set to 70%.
- β3 is the maximum acceptable Points Lost/Attempt for the tournament or league. It is 3.33 times your league average when this equation using the statistical average is set to 70%.
- β4 is based on your league average since the minimum Quiz Outs per Toss-Up Attempt is always zero. Divide 0.7 by your league average when this equation using the statistical average is set to 70%.
- β5 can either be the Net Points/Game value you consider a minimum goal or simply divide your league average by 0.7 to arrive at this number when this equation using the statistical average is set to 70%.
The five calculations are then averaged to obtain the Advanced Quizzer Rating:
AQR = (a + b + c + d + e)/5 x 100
So, yes, a quizzer who doesn’t jump at all and misses every Bonus opportunity will get a 20 AQR because they get full credit for the ‘Points Lost’ portion of the equation. This is analogous to an NFL quarterback who throws 1 incomplete pass all game and gets a 39.6 passer rating because it wasn’t an interception.
THAT’S COOL AND ALL, BUT WHAT GOOD IS IT?
Now let’s apply these calculations and see how we can use this information to strengthen our ministry and enhance quizzer effectiveness at competition. Fortunately, I used a spreadsheet to track each game while coaching my District team at December’s St. Louis Top 10 Invitational. Here’s how I would have used this information regarding three of the quizzers at that event:
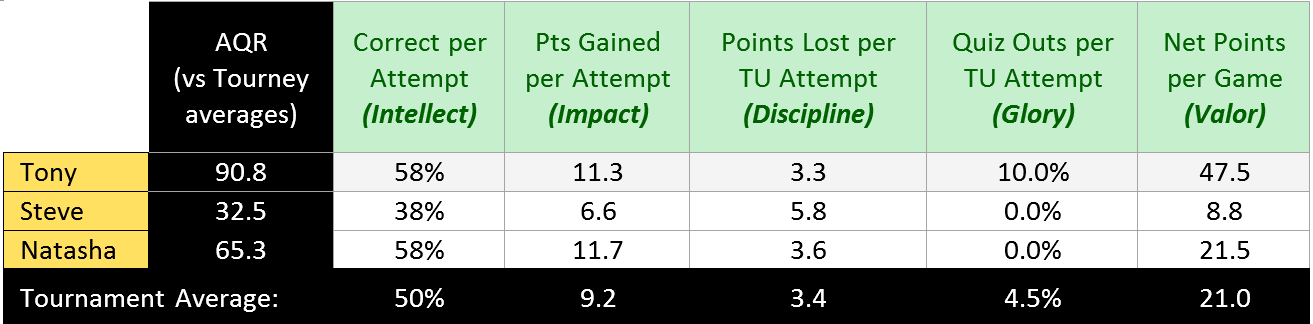
Overall, Tony performed well. His 90.8 AQR was well above the 70 mark for the statistical average. His opportunity appeared to be Points Lost per Toss-Up Attempt. If I had this information at the time, I would have encouraged him to continue being aggressive early in each match, but then call a time-out later to emphasize caution when errors result in a loss of points. Every error made after question 15 not only costs the team 10 points, but there is also a 50% likelihood that the Bonus will be answered correctly based on the tournament’s Correct per Attempt average.
Interpreting his Correct per Attempt and Points Lost per Toss-Up stats, Steve appeared to be jumping much faster than he should. This was his first St. Louis quiz and he may have thought he needed to jump way early to have a chance. As coach, I should have encouraged him to slow down a bit and wait for his questions to come to him as he eventually acclimated to the speed of the event.
Natasha’s stats are almost identical to Tony’s until you get to Quiz Outs per Toss-Up Attempt. Since her Correct per Attempt stat is well above average, I would have counseled her to jump a bit sooner and take some chances. She was one question short of a quiz-out in many games and that simple encouragement – supported by the data – might have made the difference.
NOW YOU ARE THE COACH
Here are some stats of another team at the St. Louis Top 10 Quiz:
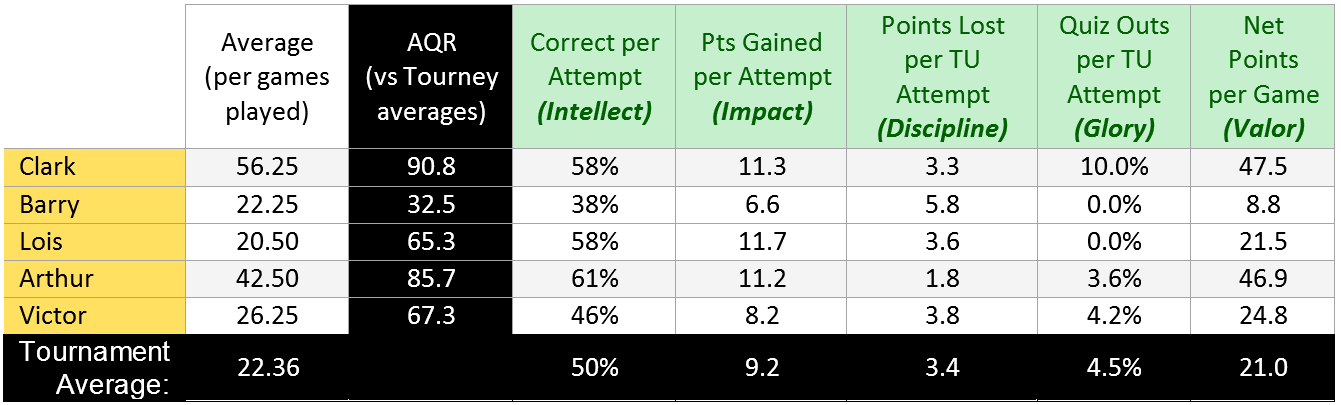
If this was your team, whom would you start? Not knowing the personalities, strengths, or history of the players, most coaches would start the match with Lois on the bench based on the traditional calculation of their averages (as shown in the first column of data). However, her AQR indicates starting her as an active quizzer would significantly improve the team’s competitiveness. Why? While she and Barry have similar averages per the traditional calculation, she is giving the opposing team many less opportunities for bonus points as indicated by her Net Points per Game stat.
CONCLUSION
Do I think we should change how we recognize achievement at a Teen Bible Quiz meet? No. (Well, maybe. But that is a discussion for another blog post). Instead, I offer this method as a tool to help you discover how to motivate your students to study God’s Word more effectively, thus strengthening your Bible Quizzing ministry. And please, if you have any thoughts on how to improve this model, let me know!
P.S.
I didn’t do all of this math by hand, nor should you. I added a tab to the Naz Quiz Scoresheet spreadsheet I use to keep score at quiz meets. In a future post I’ll cover it in more detail. Until then, you can download a copy and give it a spin:
Naz Quiz Scoresheet for iOS Numbers (2-team quizzing)
Naz Quiz Scoresheet for iOS Numbers (3-team quizzing)
On an iPad, after the link opens choose the export button (the button to the right of the address bar) and select "Copy to Numbers". If you have trouble, try the Excel link below and export that to Numbers.)
Naz Quiz Scoresheet for MS Excel (2-team quizzing)
Naz Quiz Scoresheet for MS Excel (3-team quizzing)


 RSS Feed